
Why the Lowest RO Antiscalant Price Can Increase Total Water Cost: A Total Cost of Ownership Guide for Desalination Plants
ON
Procurement teams often compare RO membrane antiscalant price on a per-kilogram or per-drum basis. That comparison is easy to make, but it rarely reflects what a desalination plant actually pays for each cubic meter of product water. For seawater and brackish RO plants across the Middle East, Africa, Central Asia, Southeast Asia, and South America, the cheapest chemical on the invoice can become the most expensive option once membrane performance, cleaning frequency, and energy use are included.
Understanding RO chemical cost through a total cost of ownership (TCO) framework helps operators make better decisions and reduce the risk of hidden losses.
Why Price per Kilogram Is Not the Right Metric
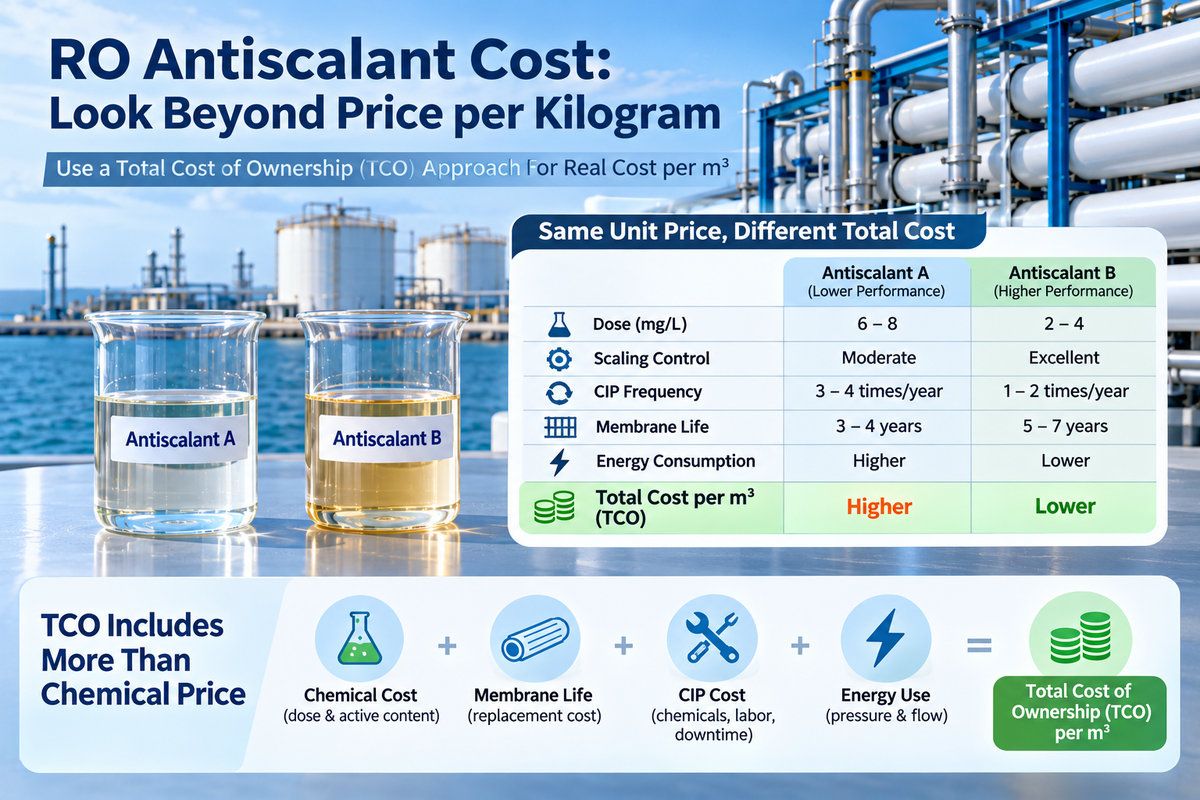
A price per kilogram tells you very little about performance. Two antiscalants can have similar unit prices but very different active content, scale inhibition efficiency, and tolerance to temperature, pH, and high-hardness feed. A product that appears cheap may require a higher dose, a higher feed concentration, or more frequent replacement to protect the membranes.
The meaningful metric is the chemical and operational cost per cubic meter of permeate produced over the plant's operating life.
Active Content, Dosage, and Maximum Recovery
Antiscalants are sold at different active concentrations, and dosing requirements depend on feed chemistry, temperature, and the target system recovery. A plant pushing recovery toward the upper design limit will need more effective inhibition, because supersaturation of calcium sulfate, barium sulfate, strontium sulfate, and silica increases as water is concentrated.
Consider a simplified example (illustrative figures only):
| Product | Price($/kg) | Active content | Required dose (mg/L) | Chemical cost per m3 Feed | Cost per m³ Permeate (75% recovery) |
| A | 2.20 | 25% | 5 | $0.0110 | $0.0147 |
| B | 3.60 | 50% | 3 | $0.0108 | $0.0144 |
Product A has the lower unit price, yet the cost per cubic meter is nearly identical before any performance differences are considered. If Product A also requires more frequent cleaning at high recovery, Product B quickly becomes the lower-cost option.
Hidden Costs of Underperforming Low-Cost Antiscalants
When an antiscalant fails to control scaling, the consequences extend well beyond the chemical line item:
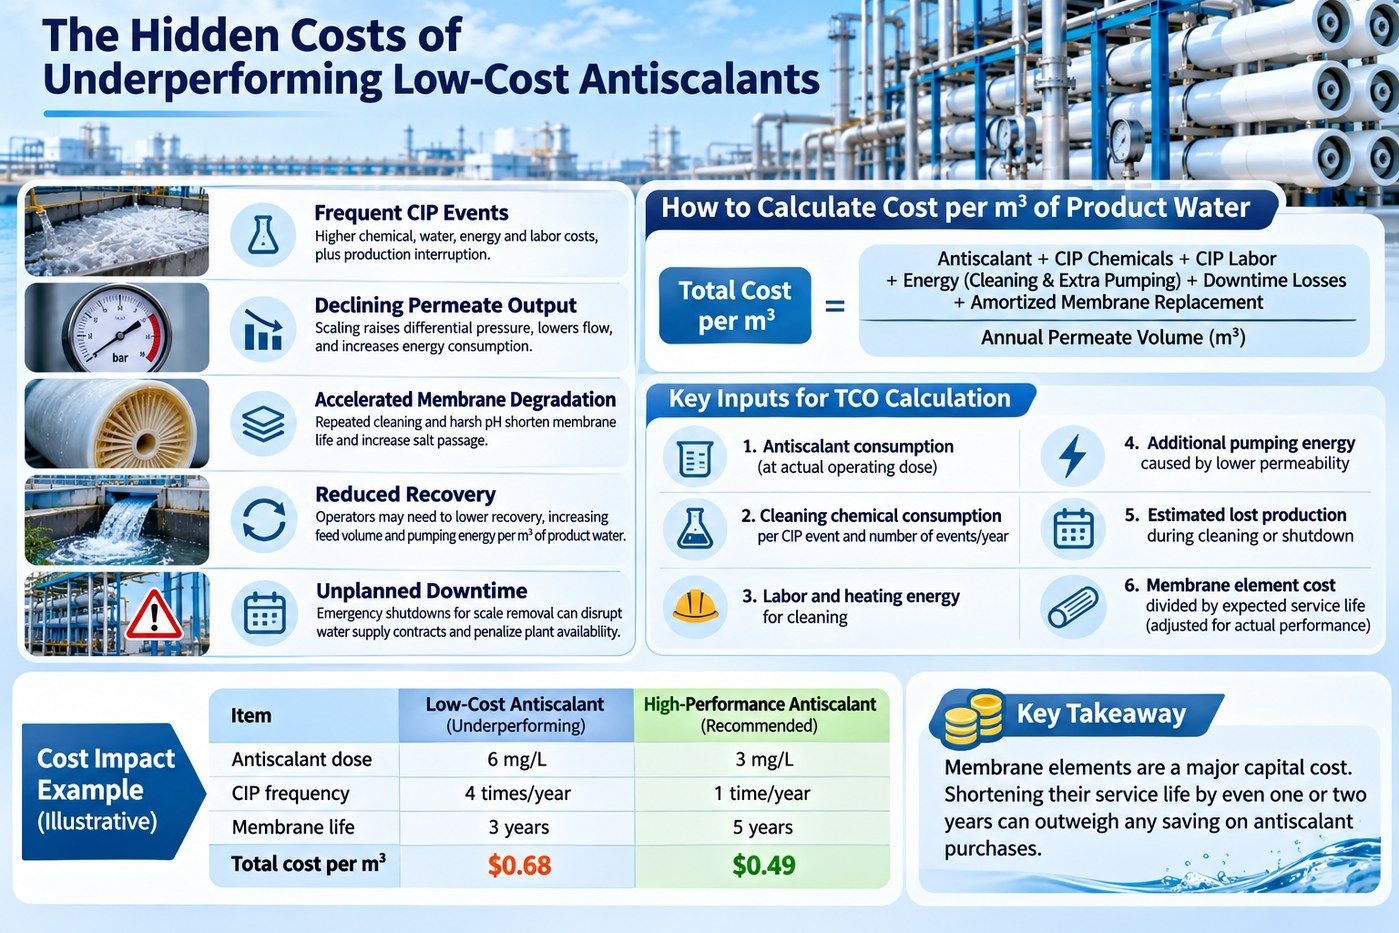
- Frequent clean-in-place (CIP) events: Each cleaning consumes acid, alkaline cleaners, water, heating energy, and labor, and it interrupts production.
- Declining permeate output: Scaling raises differential pressure and reduces normalized permeate flow, forcing higher feed pressure and energy consumption to maintain output.
- Accelerated membrane degradation: Repeated cleaning, pH extremes, and hard-to-remove deposits shorten membrane life and increase salt passage.
- Reduced recovery: Operators may need to lower recovery to protect membranes, which increases feed volume and pumping energy per unit of product water.
- Unplanned downtime: Emergency shutdowns for scale removal can disrupt water supply contracts and penalize plant availability.
Membrane elements are a major capital cost. Shortening their service life by even one or two years can outweigh any saving on antiscalant purchases.
How to Calculate Cost per Cubic Meter of Product Water
A practical TCO calculation includes all recurring costs divided by annual permeate volume:
Total cost per m³ = (Antiscalant + CIP chemicals + CIP labor + energy for cleaning and extra pumping + downtime losses + amortized membrane replacement) ÷ Annual permeate volume (m³)
Key inputs include:
- Antiscalant consumption at actual operating dose
- Cleaning chemical consumption per CIP event and number of events per year
- Labor and heating energy for cleaning
- Additional pumping energy caused by lower permeability
- Estimated lost production during cleaning or shutdown
- Membrane element cost divided by expected service life, adjusted for actual performance
Building the TCO Model: Chemicals, Membranes, and Energy
A complete TCO model connects chemical selection to operational outcomes:
- Antiscalant performance: Inhibition efficiency at target recovery, temperature, and feed chemistry
- Cleaning chemicals: Compatibility with the membrane type and the foulant types expected
- Membrane life: Expected service interval based on cleaning frequency and feed conditions
- Energy use: Specific energy consumption (kWh/m³) changes as permeability declines
When these factors are linked, the plant can compare suppliers on the cost of delivered water rather than the cost of the drum.
How to Run a Supplier Performance Comparison
Before committing to a long-term supply agreement, request side-by-side testing under site-representative conditions:
- Jar or bench tests: Evaluate scale inhibition at the target recovery, including calcium sulfate, barium sulfate, and silica control
- Pilot skid trials: Measure differential pressure, normalized flow, salt rejection, and cleaning intervals over several weeks
- Dosing verification: Confirm that the product remains stable and pumpable in the actual dosing system
- Compatibility checks: Test with the plant's cleaning chemicals and membrane type
- Batch consistency: Review certificates of analysis and request stability data for shipments
- Technical support: Assess troubleshooting response times, on-site audits, and dosing optimization services
- Membrane autopsy: When failures occur, analyze fouled elements to identify the true scaling or fouling mechanism
A supplier should be able to demonstrate both chemical performance and operational benefits, not just a competitive price.
Request a Total Cost of Ownership Evaluation
The lowest RO antiscalant price may not produce the lowest RO chemical cost per cubic meter of water. Reliable desalination requires antiscalant selection, cleaning strategy, membrane protection, and energy management to be evaluated together.
Oneschem can support your procurement decision with a customized RO antiscalant TCO evaluation template, performance comparison framework, and site-specific dosing analysis. Share your feed water chemistry, target recovery, membrane configuration, current dosing rate, CIP frequency, and energy costs, and our technical team will help you calculate the true cost of your desalination water. Contact us to request the template and start a desalination chemical procurement review that protects both your budget and your membranes.